Bridging the NGOs Data Gap
Digital transformation holds immense potential for non-profit organizations. However, the practical journey towards achieving this transformation...

Technology today has revolutionized the way we live, work, and communicate, and has become an integral part of our daily lives. This includes the non-profit sector. However, according to recent research, only 36% of non-profit professionals are "very satisfied" with the technology they have to do their jobs. This indicates a significant gap between the potential benefits of technology and its actual implementation in non-profits.

Time Consumption Data Management for NGOs
Organizations of all types and sizes generate an enormous amount of data every day, and non-profit organizations are no exception. Data plays a critical role in all areas of Non-Profits. Reliable, informative reporting can demonstrate accountability to donors and stakeholders. Furthermore, data is a valuable tool for analyzing demographic information of the communities NGO's serve.
By embracing technology and adopting a data-driven approach, non-profits can enhance their effectiveness, efficiency, and impact.
One of the number one frustrations of NGO employees is often the maintenance of a large number of reports. The constant influx of operational and financial data can be challenging to manage day to day. This is where repdev and Data Courage come in.
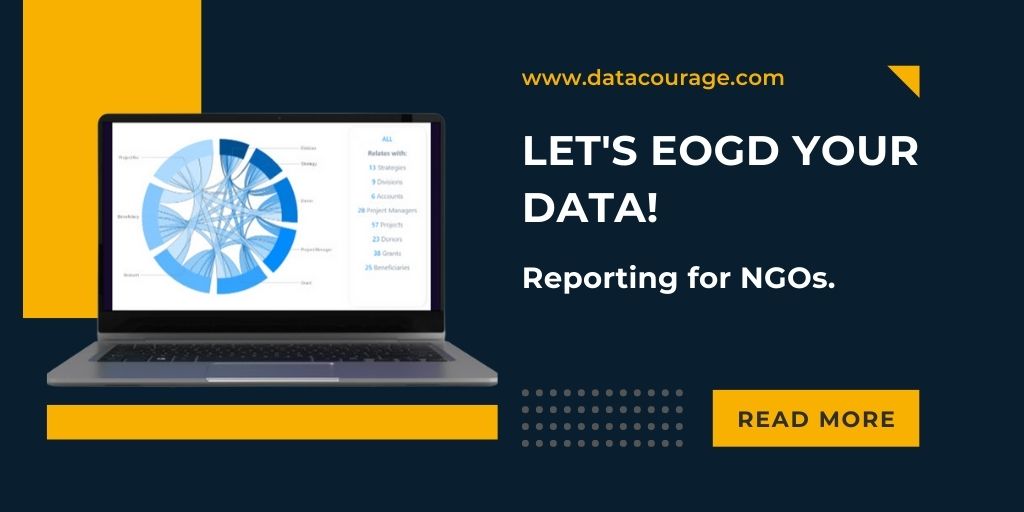
Let's EOGD Your Data!
Together, we’ve developed an innovative full-featured reporting environment by considering the most common analytical challenges and end users' expectations at all levels of an organization.
Let's EOGD Your Data - a method of data analysis that is designed to extract all the 'juice' out of your data. It involves:
your data to create meaningful insights.
The 2 perfect tools for your Data Toolbox! Jet Reports & Power BI
The combination of Jet Reports and Power BI provides the perfect solution for non-profits to manage their data effectively. Jet Reports offers fast, flexible business reporting for Microsoft Dynamics ERP in Excel, which allows you to get all the financial and operational data you need in the format you need it. Power BI is a data visualization tool developed by Microsoft with a primary focus on business intelligence. It helps create data-driven visualization with analytics and KPIs. Thus, enabling stakeholders at every level of your organization to make confident decisions using online tailor-made dashboards.
The use of Jet Reports and Power BI improves operational expert engagement. It will strengthen managerial cohesion through shared operational and financial data. Providing greater understanding, alignment, better coordination and collaboration, and faster response to opportunities and risks. This leads to better outcomes for both internal and external stakeholders.
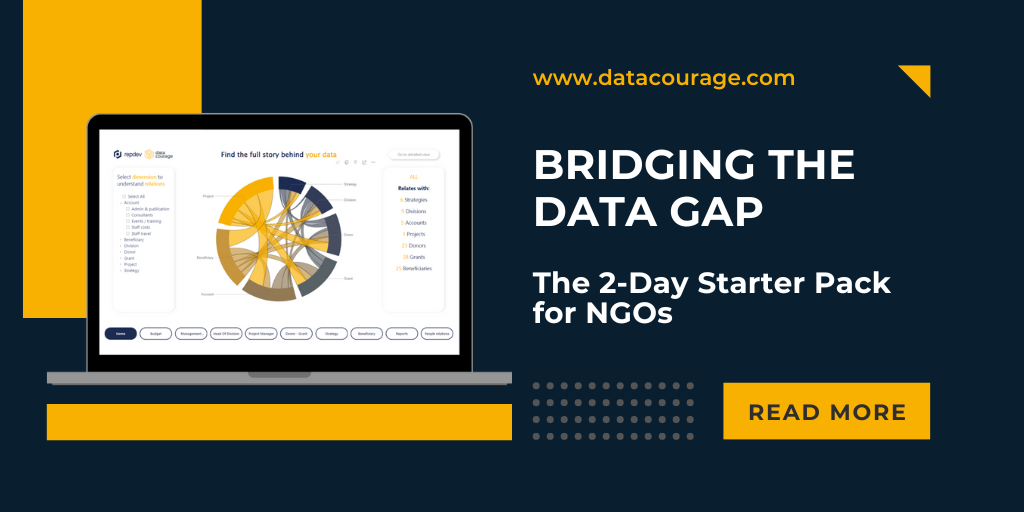
Find the full story behind your data
Finding the full story behind the data is essential for non-profits to achieve their goals effectively and efficiently. By embracing digital maturity, organizations can leverage technology to unlock the potential of their data and achieve better outcomes for everyone.
If you'd like to learn more about reporting for NGOs, download our free brochure today. Click here to get your copy now.

Digital transformation holds immense potential for non-profit organizations. However, the practical journey towards achieving this transformation...

Navigating the options for reporting and analytics tools can be challenging for Microsoft Dynamics 365 Business Central or Dynamics NAV users....

From graphs and charts to maps and diagrams, data visualization can take many forms, but the goal is always the same: to turn data into insights that...