Data Visualization: Why it Matters for Your Business
From graphs and charts to maps and diagrams, data visualization can take many forms, but the goal is always the same: to turn data into insights that...

Aren’t you tired of sifting through Business Central's static and limited reports? Look no further than Power BI! Every business needs tools to help them analyze and visualize their data in a way that is easy to understand.
Say Goodbye to Limited Reports: Power Up Your Data Analysis with Power BI
Microsoft Business Central is a powerful ERP system that helps businesses manage their financials, operations, and sales. Power BI is a business analytics service that provides interactive visualizations and business intelligence capabilities. With Power BI, you can drill down into your data and customize your display.
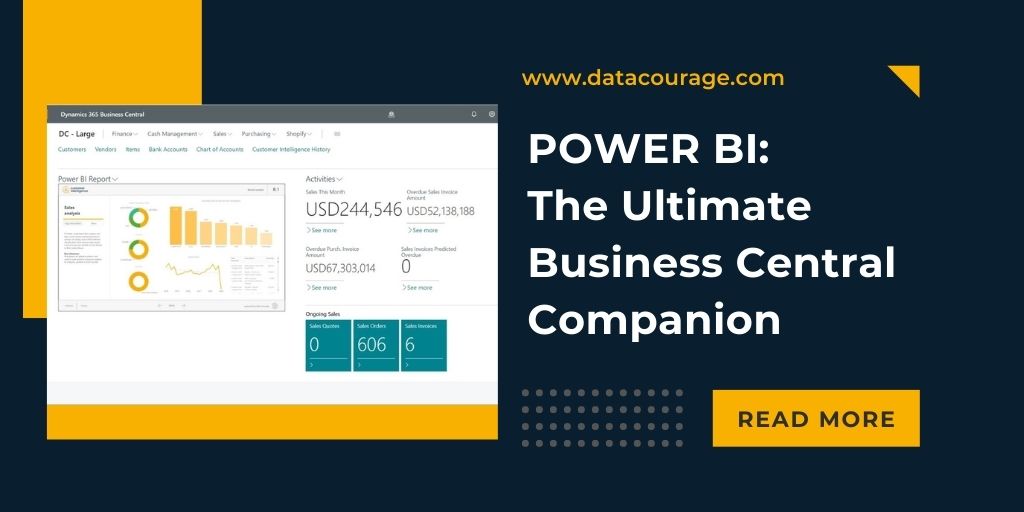
But did you know that you can have Power BI reports embedded directly within Business Central? This allows you a streamlined experience without ever having to leave the platform. Integrating Power BI dashboards into the Microsoft Business Central environment allows users to access critical data within the context of their daily workflows. This integration offers a seamless experience, allowing users to visualize their data without having to switch between multiple applications.
Customizable and Streamlined: Power BI Reports Embedded Directly within Business Central
One of the most significant benefits of embedding Power BI dashboards into the Microsoft Business Central app is the ability to drill down through customers' data. With a few clicks, users can access detailed information about customers' behavior, such as sales history, purchase patterns, and customer demographics. This information can help businesses identify trends, optimize their sales strategies, and improve customer retention.
Get Valuable Insights with Ease: AI Customer Intelligence App Powered by Power BI Dashboards
All of these are reasons we love Power BI within Business Central. Our AI Customer Intelligence App makes this easy, so you get valuable insights immediately. Power BI dashboards within our app take away the hassle of building reports yourself and provide valuable insights at your fingertips.

From graphs and charts to maps and diagrams, data visualization can take many forms, but the goal is always the same: to turn data into insights that...

Gaining deep insights into customer behavior and product performance has always been a critical factor for staying ahead of the competition. But the...

We are excited to introduce the new website of Data Courage, designed to better serve our customers and partners and provide a more user-friendly...