Power BI: The Ultimate Business Central Companion
Aren’t you tired of sifting through Business Central's static and limited reports? Look no further than Power BI! Every business needs tools to help...
3 min read
Data Courage Jul 13, 2023 4:51:46 PM

From graphs and charts to maps and diagrams, data visualization can take many forms, but the goal is always the same: to turn data into insights that can drive business decisions.
Businesses are generating an unprecedented amount of data. While collecting data is crucial, extracting meaningful insights and making informed decisions can be a daunting task without the right tools. This is where data visualization comes in, allowing businesses to transform complex data into visual representations that are easy to understand, interpret, and act upon.
Data visualization has become an essential tool for businesses of all sizes. Here are reasons why data visualization matters:
Enhanced Decision-Making
One of the primary reasons businesses need data visualization is to enhance decision-making processes. By presenting complex data visually, businesses can quickly identify patterns, trends, and outliers that are not immediately evident in raw data. This enables executives, managers, analysts, and business owners to make informed decisions based on accurate insights.
For example, imagine a retail company that wants to optimize its product pricing strategy. By visualizing sales data across different price points, they can identify the price ranges that generate the highest sales volumes and profits. This allows them to make data-driven decisions on pricing adjustments and maximize their revenue potential.
Data visualization simplifies the understanding of complex information by presenting it visually. Humans are naturally inclined to process visual information more efficiently than raw data in tables or spreadsheets. By transforming data into intuitive charts, graphs, or heat maps, businesses can communicate complex concepts effectively and ensure that stakeholders grasp the insights.
Consider a healthcare organization analyzing patient satisfaction survey results. Instead of presenting rows of survey responses, they can create a visually appealing dashboard that highlights key satisfaction metrics. Through bar charts or radar plots, they can quickly identify areas where improvements are needed. For example, wait times or communication flaws. Implementing efforts to improve these metrics will enhance the patient's experience.
Identification of Trends and Patterns
Data visualization enables businesses to identify trends, patterns, and correlations within their datasets. These insights can uncover valuable opportunities and drive innovation. With interactive visualizations, users can explore data from different angles, drill down into specific details, and discover hidden relationships that may have otherwise gone unnoticed.
For instance, a marketing team analyzing customer behavior data might create a visualization that maps out the customer journey from awareness to purchase. By analyzing this visualization, they can identify common paths taken by customers, potential bottlenecks, and opportunities for targeted marketing campaigns or personalized recommendations.
Effective Communication and Storytelling
Data visualization provides a powerful storytelling mechanism, allowing businesses to convey complex information in a compelling and memorable way. By presenting data visually, businesses can engage their audience, build a narrative, and leave a lasting impact.
Imagine an environmental organization aiming to raise awareness about pollution levels in different cities. By creating visualizations that compare air quality indices, they can illustrate the severity of pollution in a simple and impactful manner. This visualization can be shared through social media or incorporated into presentations, effectively conveying the organization's message and inciting action from the audience.
Getting Started with Data Visualization
When it comes to effectively visualizing and deriving insights from data, having the right tool is crucial. Microsoft Power BI stands out as an exceptional platform that empowers businesses to embark on their data visualization journey, unlock valuable insights, and create compelling visual representations effortlessly.
Power BI offers a rich array of visualization options to effectively communicate your data story. From charts and graphs to maps and other visual elements, Power BI equips you with the tools to bring your insights to life in a visually appealing and informative manner. Whether you need to present sales trends, customer demographics, or geographical data, Power BI provides a wide range of options to suit your specific needs.
Data exists in various formats and originates from diverse sources. Power BI enables seamless connectivity to multiple data sources, whether it's Excel spreadsheets, SQL databases, cloud services like Azure, or online platforms such as Salesforce or Google Analytics. By integrating your data into Power BI, you can consolidate and transform raw information into a unified, structured format. Power BI's data modeling capabilities empower you to clean, filter, and transform data, ensuring accuracy and consistency across your visualizations.
Data Courage is here to help
With our expertise in data visualization, we can transform raw data into stunning visual representations tailored to your business needs. Whether it's interactive dashboards, customized reports, or captivating infographics, Data Courage can bring your data to life and enable you to make more informed business decisions.
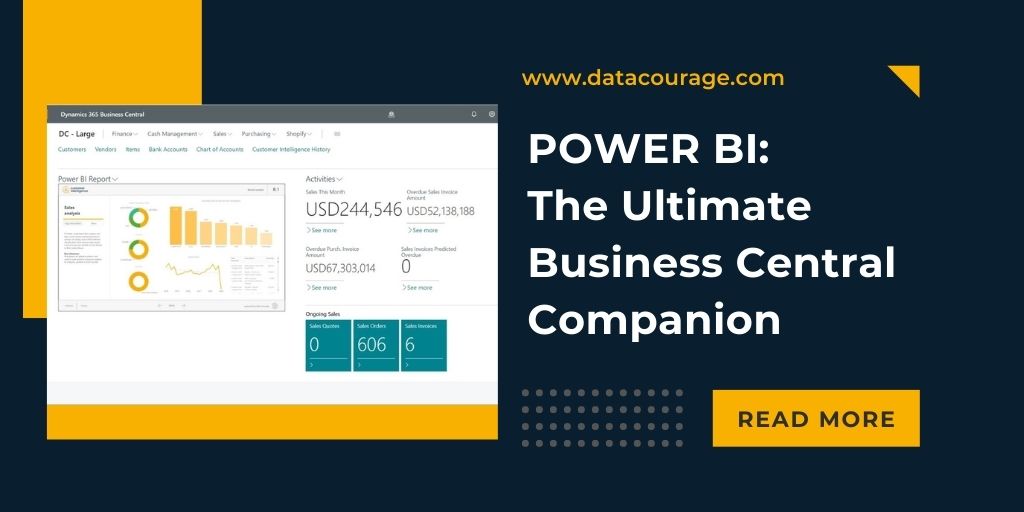
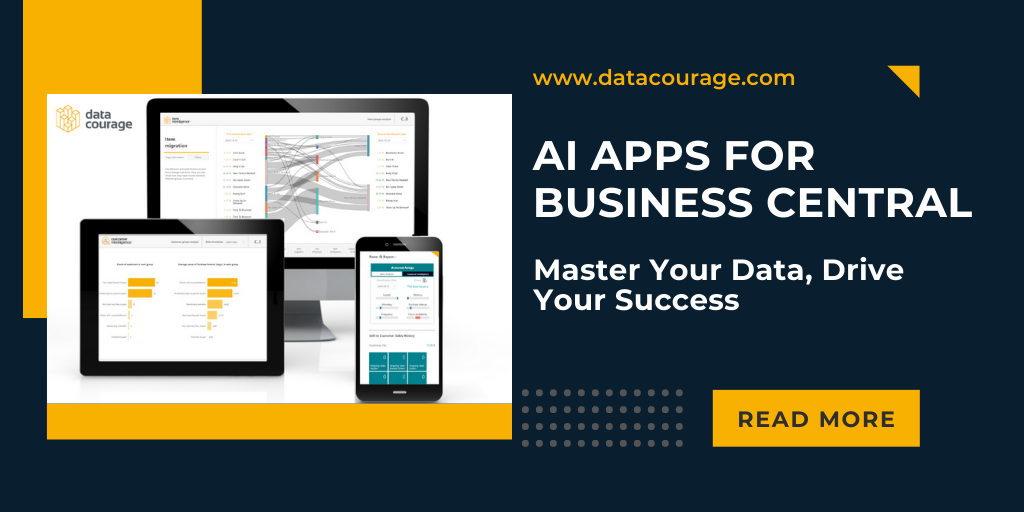
You can see what our Power BI Dashboards look like in our AI Apps for Business Central: Customer Intelligence and Item intelligence. We’ve embedded Power BI Dashboards directly into the Microsoft Business Central environment, making it easier than ever before to understand your data.
Learn more about Power BI and Microsoft Business Central.
So, why settle for overwhelming spreadsheets and dull reports when you can harness the power of data visualization? Embrace the visual revolution and transform your data into actionable insights with the help of Data Courage and the incredible capabilities of Power BI. At Data Courage, we specialize in helping businesses turn data into insights through the power of data visualization. Contact us today to learn more about how we can help you make the most of your data.

Aren’t you tired of sifting through Business Central's static and limited reports? Look no further than Power BI! Every business needs tools to help...

Gaining deep insights into customer behavior and product performance has always been a critical factor for staying ahead of the competition. But the...

Navigating the options for reporting and analytics tools can be challenging for Microsoft Dynamics 365 Business Central or Dynamics NAV users....